Coding agents: why peer adoption matters as much as the tool
Three Microsoft researchers published, on 1 July 2026, the first field study to use developer-level telemetry to measure both the adoption of command-line coding agents and their effect on output. The setting covers tens of thousands of engineers, from 5 January to 29 April 2026, around the rollout of Claude Code and GitHub Copilot CLI. Two findings frame the paper: first use spread primarily through internal social networks, and adopters merged roughly 24% more pull requests than they would have otherwise, a gap that holds across the whole four-month window.
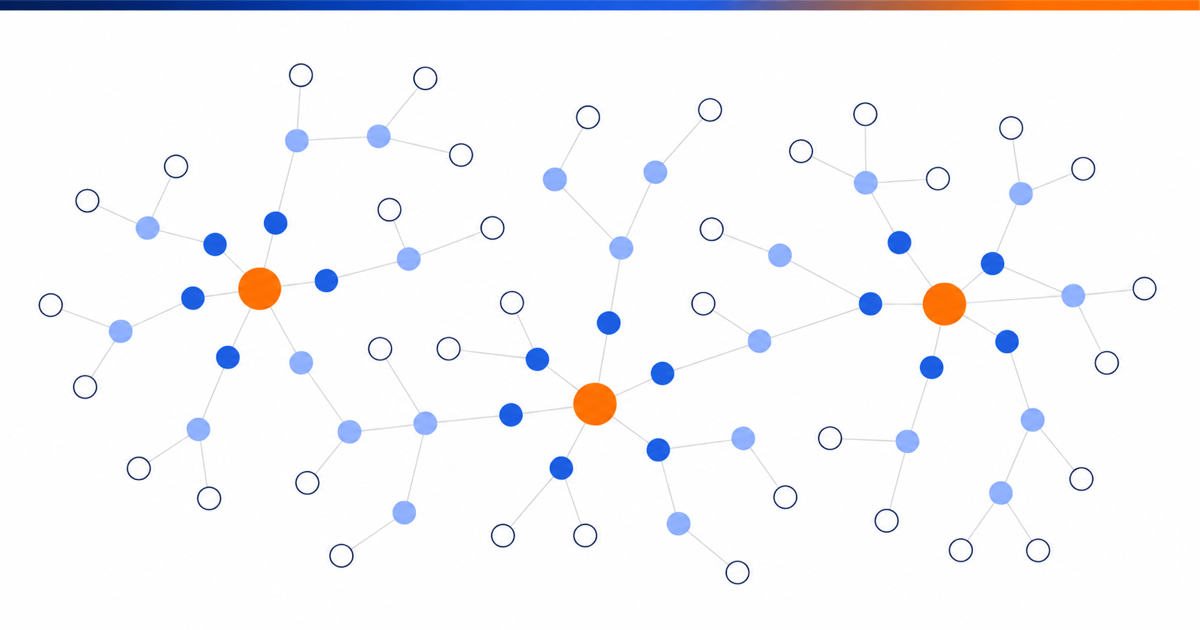
In most companies, the debate about these tools is about picking the product and pricing the licences. The study puts its largest coefficient somewhere else entirely, and it is not technical: an engineer where more than a quarter of their skip-level peers were already using the tool had 216% higher odds of trying it. Having a manager who used it was worth 82%, and reviewer peers 54%. No individual characteristic measured in the study comes close to those values. The authors' conclusion is explicit: organisations should treat visible peer use as central to rollout strategy.
The 5 July article on harness engineering in practice covered configuring these tools, meaning what happens once a team is using them. What follows covers the step before, the one rollout plans almost always skip: who tries, who stays, what the measured gain proves, and what it does not.
What the study measures, and what it does not
The design separates two things dashboards constantly conflate: initial use, and retention, defined as sustained early use. The factors predicting one are not the factors predicting the other, and that is the paper's most useful result for anyone preparing a rollout.
The most counterintuitive detail concerns users of the previous generation. Engineers already using Copilot inside their IDE were considerably more likely to try the command-line version, from 49% to 83% higher odds depending on how heavily they had used it. But those same engineers were less likely to stay, with all three retention markers negative, between 12% and 15% below an engineer who had never used the IDE tool. The cohort everyone would instinctively pick as a spearhead therefore produces plenty of trials and few durable installs. What predicts retention is actual shipping activity: retention rises with prior pull request volume, up to 31% for engineers opening two or more per week.
The seniority gradient also deserves careful reading, because it is weak and often misquoted. Junior engineers tried the tool less than the mid-level reference, by 13% to 14%. Senior engineers tried it more, around 22% at one level, but their retention markers sat near zero. Managers were not statistically distinguishable from the reference. Seniority therefore drives curiosity, not persistence.
On the measured effect, two caveats should travel with the figure wherever it is quoted. The first comes from the authors themselves, in the abstract: merged pull requests serve as a proxy for output, while acknowledging that a merged pull request is not the same as the value it delivers. The second concerns who is publishing. Microsoft is measuring a rollout of two tools, one of which it makes, and the comparison between them produces a large gap: comparing each engineer's usage weeks against their own zero-usage weeks, Claude Code is associated with an 11.4% rise in merged pull requests and Copilot CLI with 24.9%, roughly 2.2 times more. The authors hide nothing, report the significance, and note that their internal survey does not explain the gap. Still, a comparative result favouring the publisher's own product, published by that publisher and left unexplained, should never serve as a selection argument in a purchasing committee.
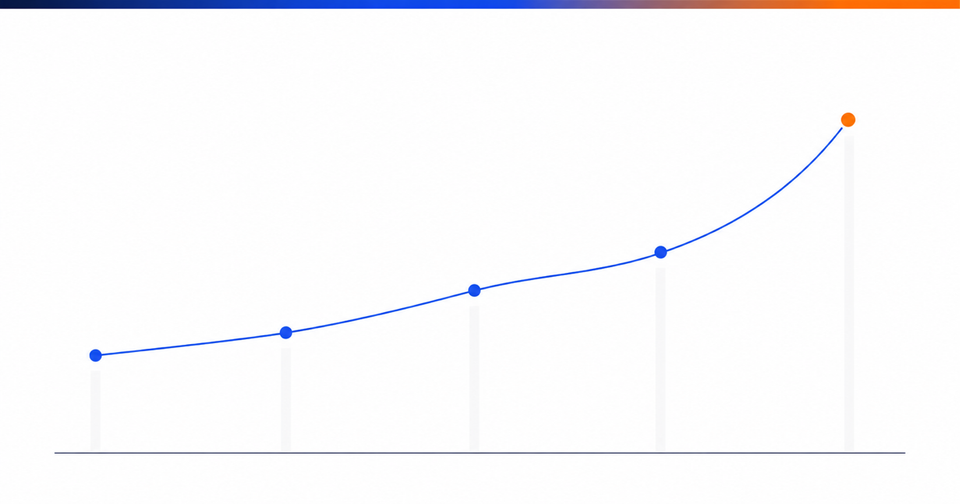
What survives that caveat better is the relationship between intensity of use and output, measured by comparing each engineer against themselves. The curve is monotone: around 15% more merged pull requests at three days of use in a week, rising to 50% at five days or more. That shape is more informative than any average, because it says a broad, lightly used rollout produces almost nothing.
What 24% more pull requests does not tell you
A throughput metric becomes dangerous the day it becomes the target. Pull requests can be split, and nothing is easier to improve than merged pull requests per engineer. So the place to look is the other end of the chain, at the reviewers.
A study published in May 2026 by researchers from the University of Notre Dame, Vanderbilt and Google provides that counterweight on independent ground: 20,574 real coding-agent sessions across 1,639 repositories, in both IDE and command-line workflows. The authors measure misalignment between developer and agent, identified through explicit user pushback. Two numbers matter to a decision maker. First, 90.50% of episodes translate into effort and trust costs rather than irreversible damage, which is reassuring on risk. Second, 91.49% of visible resolutions still require an explicit correction from the user, which is far less reassuring on cost. The authors also note a shift over time: overall misalignment rates decline, but constraint violations and inaccurate self-reporting by the agent grow as a share.
That last point belongs in any CTO's notes. An agent that gets something wrong and says so costs time. An agent that gets something wrong and reports success moves the cost onto review, and that load appears in no throughput metric. The pattern recurring in mature rollouts is exactly this: the team producing saves time, the team reviewing loses it, and the net result depends entirely on whether review was reinforced at the same moment.
Then there is cost, which the Microsoft study puts front and centre by noting that at organisational scale token spend can run into millions of dollars annually. The paper cites a press-reported order of magnitude at another large company, where cumulative employee usage exceeded 60 trillion tokens over thirty days. It is a reminder that measuring the gain means nothing without measuring the spend, exactly the framing proposed in the 17 July article on measuring AI ROI.
The instrumentation plan, before activation
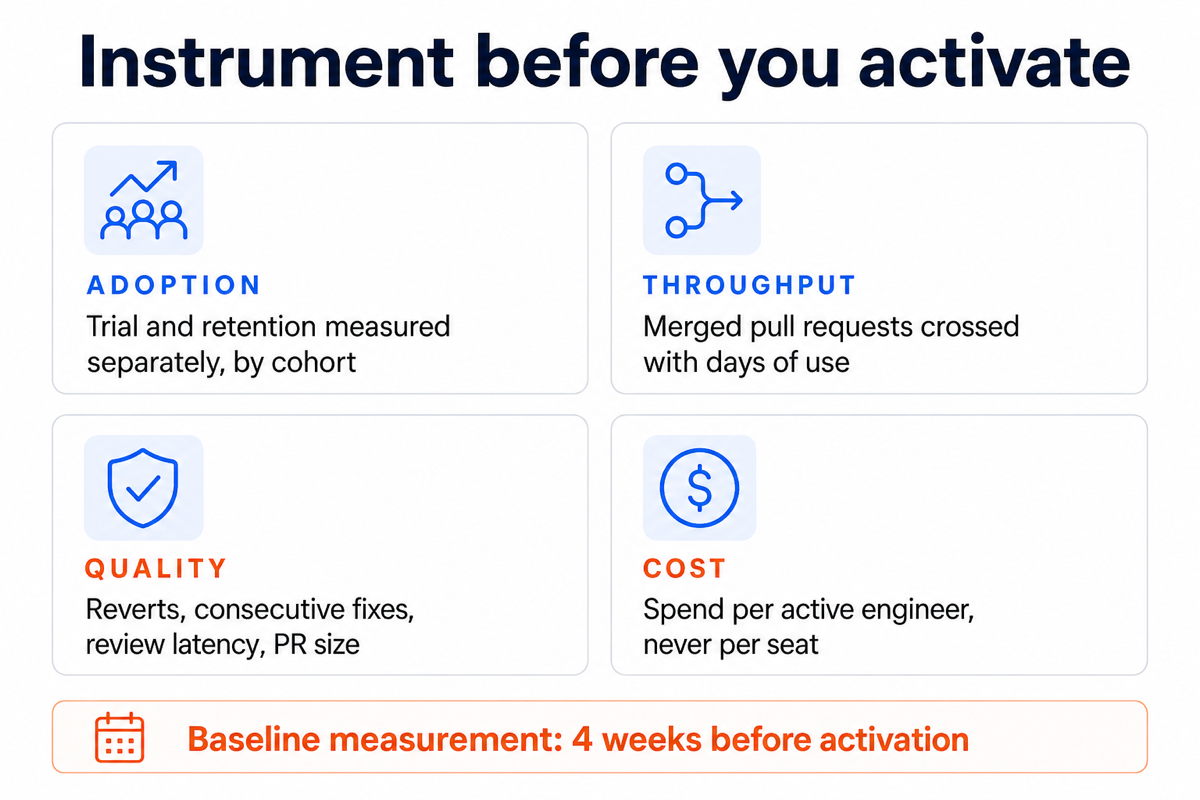
The practical consequence is an order of operations, and it is almost always the one that gets reversed. Four families of metrics have to exist before a single licence is activated, otherwise you will never have a basis for comparison.
Adoption and retention per cohort, measured separately. Seats assigned is not an adoption metric, and trials is not a retention metric. Settle on an explicit definition of sustained use, such as a number of active days over a rolling window, and hold to it.
Throughput, with the associated dose. Tracking merged pull requests without tracking days of use per week averages heavy users together with dormant accounts, and produces a result that describes nobody.
Quality and rework. Revert rate, rate of consecutive fix commits, review latency and pull request size. These four degrade first when throughput becomes the target, and they are the ones almost always missing from rollout dashboards.
Cost per active engineer, not per seat. The distinction is not accounting, it is decisional: it tells you whether you are funding usage or inventory.
What to put in motion this week
Pick two or three visible cohorts rather than a general rollout. The study's most robust finding is that usage spreads through working proximity, which means a rollout by announcement and licences for everyone produces seats, not adopters.
Select those cohorts on shipping activity rather than declared enthusiasm or prior AI tool usage. That is the only criterion the study associates positively with retention, and the intuitive criterion points the other way.
Measure your baseline before activating anything. Four weeks of measurement across the four families above costs little and is worth more than six months of arguing about attribution.
Reinforce review at the same time you activate the tool, not afterwards. Plan explicitly for the extra load on reviewers and for a rule on maximum pull request size.
Finally, write down before you start what would count as failure: what retention level at twelve weeks, what cost per active engineer, what quality degradation would make you stop. A stop criterion written in cold blood is the only protection against a rollout that continues out of inertia.
Conclusion
This study is the best public data available on the subject and deserves to be read for what it is, an honest measurement reported with its limits, including the ones its sponsor could have kept quiet. What it shifts is not the debate about tools, which it does not settle and does not claim to. It is the nature of rollout work: the variable you have the most control over is neither the model nor the product, it is the choice of the few teams whose work everyone else watches.
Sources: As of July 2026
- [Primary] Adoption and Impact of Command-Line AI Coding Agents: A Study of Microsoft's Early 2026 Rollout of Claude Code and GitHub Copilot CLI — Emerson Murphy-Hill, Jenna Butler, Alexandra Savelieva, Microsoft (arXiv:2607.01418) — 1 July 2026 — https://arxiv.org/abs/2607.01418
- [Primary] How Coding Agents Fail Their Users: A Large-Scale Analysis of Developer-Agent Misalignment in 20,574 Real-World Sessions — University of Notre Dame, Vanderbilt University, Google (arXiv:2605.29442) — 28 May 2026 — https://arxiv.org/abs/2605.29442
- [Secondary] AI Tooling for Software Engineers in 2026 — The Pragmatic Engineer — 2026 — https://newsletter.pragmaticengineer.com/
- [Secondary] Developers remain willing but reluctant to use AI: the 2025 developer survey results are here — Stack Overflow — 2025 — https://stackoverflow.blog/2025/07/29/developers-remain-willing-but-reluctant-to-use-ai-the-2025-developer-survey-results-are-here/
- [Secondary] AI coding agents helped Microsoft engineers merge more pull requests — TechRepublic — July 2026 — https://www.techrepublic.com/article/news-ai-coding-agents-microsoft-pull-requests/

Comments ()