Measuring AI ROI: the framework CFOs and CTOs have been waiting for

The 2026 paradox fits in two numbers. Enterprises spent $37 billion on generative AI in 2025, up from $11.5 billion in 2024, according to Menlo Ventures' State of Generative AI in the Enterprise report (December 2025). Meanwhile, McKinsey's State of AI survey (2026) shows that 88% of organizations are experimenting with GenAI, yet nearly 80% report no tangible enterprise-level EBIT impact.
Budgets tripled. Proof of value barely moved. And boards are starting to ask the uncomfortable question: where is the return?
This gap is not a technological inevitability. A separate 2025 IDC survey, sponsored by Microsoft and covering more than 4,000 business leaders, found organizations reporting a median 3.7x return on their generative AI investment, concentrated among those that deploy with a defined scope and a measurable baseline. The problem is not that AI doesn't pay. The problem is that most companies can't count, neither what it really costs nor what it really returns.
The counterintuitive instinct to correct upfront: faced with ROI that doesn't show up, the first reflex is to look for a better use case or a better model. The IDC data suggests that's almost never the problem. The organizations landing at that 3.7x median don't have better models than everyone else, they have a complete cost denominator and a baseline measured before deployment, two things that cost nothing to set up and that most teams skip for lack of time during the pilot.
This article lays out a three-tier measurement framework, a method for calculating total cost, and a one-page reporting format for your next board meeting. It closes the operational series that started with agent security (July 13) and regulatory audits (July 15): after control and compliance, proof of value.
Why your current metrics convince no one
Most AI dashboards presented to executive committees mix three families of numbers that answer different questions.
The first family covers technical metrics: latency, availability, hallucination rates, tokens consumed. They are essential for operating the system and useless for proving its value. No CFO has ever approved a budget based on p95 latency.
The second family covers adoption metrics: active users, daily queries, usage rates per team. They measure appetite, not yield. Massive adoption of a tool that changes nothing in the P&L is still a cost.
The third family, the most misleading, gathers self-reported productivity gains. "Our developers estimate they save 30% of their time" is internal survey data, not an accounting line. Until those hours translate into lower unit costs, higher delivered capacity, or additional revenue, they do not exist for the board.
MIT NANDA's The GenAI Divide report (July 2025, based on 150 executive interviews, 350 surveyed employees, and 300 analyzed deployments) already quantified the phenomenon: roughly 95% of GenAI pilots produce no measurable P&L impact. The 5% that succeed share one trait: they embed AI in high-value workflows with measurement loops defined before deployment, not after.

Gartner's 2026 surveys confirm the problem persists on the finance side: of more than 200 finance chiefs surveyed, only 36% feel confident in their ability to deliver real enterprise-scale impact with AI. And roughly 28% of AI use cases fully meet ROI expectations. This is not a model problem. It is a measurement problem.
The total cost nobody calculates
Before measuring returns, you need to measure the full investment. Most AI business cases only count API and license costs. The total cost of ownership of a production AI system has four components.
The first is inference. It is the most visible, and it is becoming structural: Morgan Stanley research points to inference, not training, becoming the dominant driver of AI compute spend as deployment scales into real-world consumer and enterprise use, part of a projected $3 trillion in data center investment between 2025 and 2028. AI is no longer a one-time capital project; it is a recurring, usage-indexed operating cost. We covered the optimization levers in the July 3 article (inference costs) and the July 11 article (token budgeting for agents).
The second component, the most underestimated, is the cost of humans in the loop. Every AI output that requires review, validation, or correction consumes skilled hours. A system that automates 80% of a process but requires a senior expert to verify 100% of it can cost more than the original process. This line should be quantified as hours multiplied by the loaded cost of the profiles involved, per month, starting in the pilot phase.
The third component covers maintenance and continuous evaluation: prompt and harness updates at every model change, evaluation suites to maintain, drift monitoring. Teams that ignore it discover it at their provider's first version change.
The fourth component is compliance. Technical documentation, risk registers, traceability: the July 15 article detailed what auditors actually check. These requirements carry a recurring cost that belongs to the system's TCO, not to the general compliance budget.
This framing matches the dominant executive concern: cost and resource consumption top the worry lists in the 2026 MIT Technology Review Insights studies we used in previous articles. A credible ROI starts with an honest denominator.
A three-tier framework
Once total cost is established, value is measured across three successive tiers. Each tier answers a different question, with its own metrics and time horizon.
Tier 1 measures operational efficiency: cycle time on priority workflows, cost per resolved ticket, per processed document, per deployment. The MIT Technology Review Insights and Thoughtworks report on operational excellence (June 2026) documents up to 50% efficiency gains with an AI copilot on DMAIC methodologies. These metrics are leading indicators: necessary, never sufficient. They show the system works, not that it pays.
Tier 2 translates efficiency into P&L impact: lower unit cost per transaction, margin per case, revenue per FTE, delivered capacity at constant headcount. This is the only tier a board funds durably. The transition from tier 1 to tier 2 is precisely where 80% of organizations fail: saved hours only become value if they are reallocated to billable production, absorb growth without hiring, or cut external costs.
Tier 3 captures strategic optionality: new capabilities (a service impossible without AI), speed to market, accumulated data assets. This tier is measured in real options, not discounted cash flows. It justifies a minority share of the portfolio, never the whole. An AI portfolio entirely justified by tier 3 is a portfolio of bets.
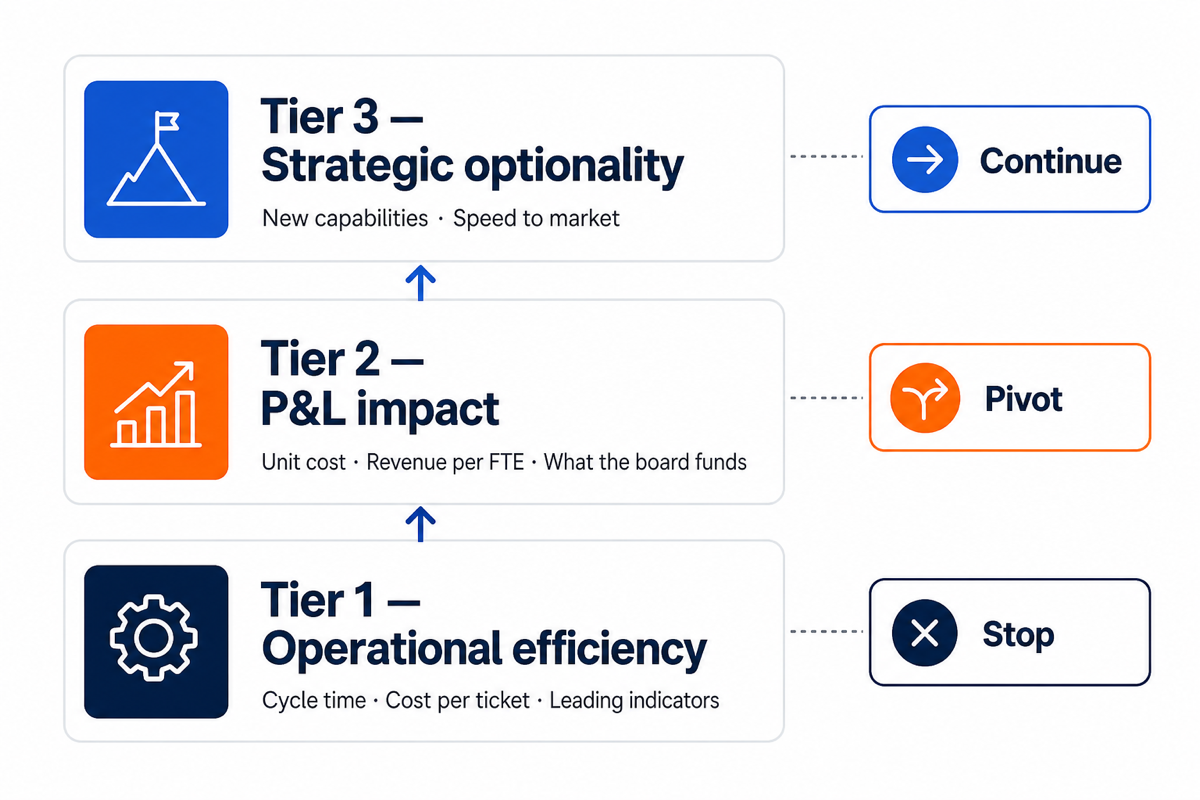
For each use case, attach explicit decision thresholds, set before deployment. Continue: tier 2 progresses toward its 6-month target. Pivot: tier 1 performs but tier 2 stalls; the problem is organizational (hour reallocation, process redesign), not technical. Stop: neither tier 1 nor tier 2 moves after two iterations. Gartner estimates that over 40% of agentic AI projects risk cancellation by 2027: better to stop on criteria than on budget fatigue.
Upstream use case selection conditions everything else. The MIT NANDA report finds that tools purchased from specialized vendors succeed about 67% of the time, versus a third of that rate for internal builds. The delegate-or-supervise grid from the July 9 article remains the right entry filter: no measurement framework will save a poorly chosen use case.
Presenting the numbers to the board
Format matters as much as substance. Three rules make AI reporting credible in the boardroom.
First rule: one page per use case, not a twenty-slide deck. Total cost (four components), tier 1 and tier 2 metrics with baseline and target, decision threshold, continue/pivot/stop status. The board doesn't want to understand the architecture; it wants to know whether the investment is on trajectory.
Second rule: the baseline precedes deployment. A productivity gain without a documented starting point is unverifiable, and CFOs know it. Measuring cost per transaction, cycle time, and team capacity before go-live is the only way to make attribution defensible. It is also what distinguishes the organizations achieving that 3.7x median in the IDC data: defined scope, measurable baseline.
Third rule: honest attribution. Deploying a copilot almost always comes with a process redesign, and part of the gain comes from the redesign, not the model. Separating the two in the presentation costs a few points of displayed ROI and buys something more valuable: the committee's trust for the next budget request. In 2026, boards no longer fund projections; they fund measured trajectories.
What to set in motion this week
Inventory the AI use cases in production and check, for each one, that a baseline dated before deployment exists. Where there is none, reconstruct it now from historical data: every month of delay makes attribution weaker.
Quantify the human-in-the-loop cost on your main use case: review and correction hours multiplied by loaded cost, over the last 30 days. Add this line to the TCO presented to the committee.
Classify each use case across the three tiers and identify those stuck at tier 1 for more than two quarters. For those, ask the organizational question: where do the saved hours go?
Set continue/pivot/stop thresholds per use case and have the CFO validate them before the next committee. A threshold validated calmly avoids arbitration under pressure.
Prepare the one-pager for your most advanced use case in the format described above. It is the prototype of your recurring reporting.
Conclusion
The gap between $37 billion spent and 80% of organizations without measured EBIT impact does not say AI doesn't pay. It says most companies have not yet built the measurement apparatus that turns local gains into consolidated proof of value. This work belongs as much to the CFO as to the CTO: a complete denominator, three tiers of metrics, thresholds decided in advance, honest attribution. The organizations documenting a 3.7x median do not have better models than everyone else. They have better baselines.
Sources: As of July 2026
- [Primary] The State of AI — McKinsey — 2026 — https://www.mckinsey.com/capabilities/quantumblack/our-insights/the-state-of-ai
- [Primary] 2025: The State of Generative AI in the Enterprise — Menlo Ventures — December 2025 — https://menlovc.com/perspective/2025-the-state-of-generative-ai-in-the-enterprise/
- [Primary] The GenAI Divide: State of AI in Business 2025 — MIT NANDA (Aditya Challapally et al.) — July 2025 — https://mlq.ai/media/quarterly_decks/v0.1_State_of_AI_in_Business_2025_Report.pdf
- [Primary] The Business Opportunity of AI — IDC, sponsored by Microsoft (4,000+ business leaders surveyed) — January 2025 — https://news.microsoft.com/en-xm/2025/01/14/generative-ai-delivering-substantial-roi-to-businesses-integrating-the-technology-across-operations-microsoft-sponsored-idc-report/
- [Primary] CFO surveys and agentic AI forecasts — Gartner — 2026 — https://www.gartner.com/en/articles/ai-agent-layer
- [Primary] Achieving operational excellence with AI — MIT Technology Review Insights — July 2, 2026 — https://www.technologyreview.com/2026/07/02/1140045/achieving-operational-excellence-with-ai/
- [Secondary] 100-CIO survey, LLM budget growth — a16z — 2025 — https://a16z.com/ai-enterprise-2025/
- [Primary] AI Enters a New Phase: The Rise of Inference and Data Infrastructure — Morgan Stanley Wealth Management — November 4, 2025 — https://www.morganstanley.com.au/ideas/ai-enters-a-new-phase-of-inference
Comments ()