Your agent benchmark gives you a score, not a map of its limits
A benchmark published on arXiv on 9 July 2026 illustrates, better than any argument could, what agent evaluation fails to measure. Long-Horizon-Terminal-Bench gathers 46 long tasks across nine categories, from experiment reproduction to software engineering and scientific computing, each decomposed into finely graded subtasks. Across fifteen frontier models evaluated, the best reaches 15.2% pass@1 at a partial-reward threshold of 0.95, and 10.9% at the perfect threshold. The mean across all models falls to 4.3% and 1.7%. Tasks consume on average 9.9 million tokens, roughly 231 episodes and 85.3 minutes of execution per run.
The reflex on seeing these numbers is to read a verdict into them, favourable or damning depending on the mood of the day. That misses the methodological point, which is the real contribution here. The authors build dense grading because outcome-only evaluation overlooks intermediate progress and partial solutions, yielding a sparse signal and an incomplete picture of capability. Put another way, and this is the single most useful observation in the whole literature: in a multi-verifier task, an all-or-nothing rule assigns exactly the same zero to a trajectory that satisfies no requirements and to one that satisfies nearly all of them. Yet those two situations call for opposite decisions, one to abandon, the other to adjust guardrails.
The 6 August article on the determinism test proposed deciding step by step what stays as code. It assumed you knew where your agent breaks. What follows tackles that question directly, and proposes replacing the single score with a frontier map, by deliberately varying the parameters that determine real difficulty.
Why a single score stops discriminating
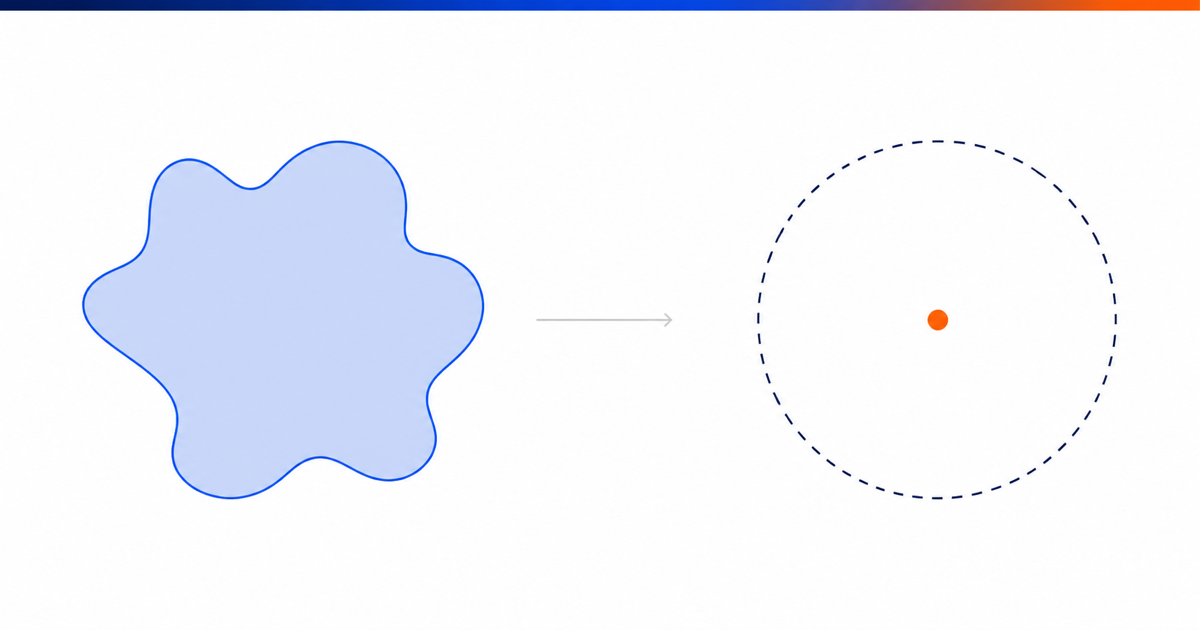
Two independent mechanisms make the score misleading, and they pull in opposite directions.
The first is saturation. Function-calling benchmarks now approach a score of 0.97 among frontier models, meaning a ceiling where a good model and a very good model return the same result. A saturated test keeps running and keeps producing a reassuring figure; it has simply stopped separating. The phenomenon has been documented since the start of the year on the industry's most-cited evaluation sets, and it carries an uncomfortable consequence: the more a benchmark is quoted, the more likely it has been optimised against, and therefore the more likely it lost its discriminating power at exactly the moment you started leaning on it.
The second mechanism is the setting. Work published in June 2026 under the title Running the Gauntlet re-evaluates agent capabilities outside familiar environments, and the strongest agent there reaches a 19.1% success rate. The gap with scores published on the usual benchmarks does not say models have regressed, it says the measured performance was partly a performance of environment. An agent that excels in a setting it saw a great deal of during training tells you nothing about its behaviour in your data warehouse, with your naming conventions and your poorly documented tables.
Between those two mechanisms sits a third factor that almost no internal evaluation simulates: failure. Work that injects tool-call failures, by randomly rejecting a fraction of calls, finds that even a modest failure rate of around ten percent noticeably degrades performance across all horizon and difficulty levels. Your production environment has rate limits, timeouts and unavailable services. An evaluation run under perfect conditions measures an agent you will never operate.
Five axes to vary rather than one score to publish
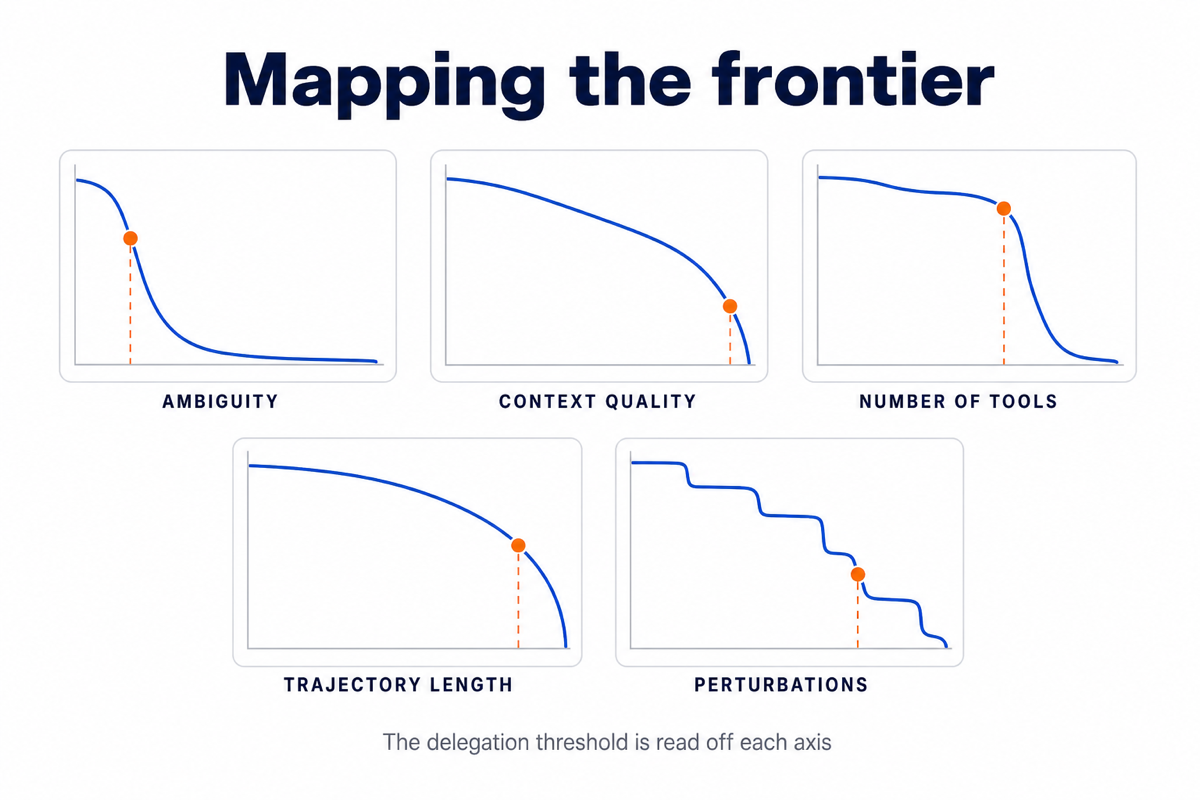
Moving from a score to a map means choosing the dimensions along which difficulty rises, then measuring where success breaks down on each. Five axes cover the essentials, and they are independent of one another.
Request ambiguity. Write the same task at three levels of precision, from a full specification down to a spoken formulation of the kind a business team would actually produce. This is the most predictive axis, and the one internal evaluation sets unwittingly standardise away, since they are written by people who already know the right answer.
Context quality. Vary what the agent receives: current documentation, partly outdated documentation, contradictory documentation. On a data agent this becomes very concrete as finding the right table in a warehouse where several tables carry similar names and two of them are deprecated with nothing indicating it.
Number of exposed tools. Measure the same task with five tools available, then twenty, then fifty. Degradation is not linear, and the breaking point tells you directly the maximum toolbox size you can hand this agent.
Trajectory length. The benchmark cited above shows the order of magnitude that long tasks imply, with hundreds of episodes and tens of minutes of execution. Measure success at five steps, twenty and fifty, and look at where the curve collapses rather than keeping an average that describes nobody.
Perturbations. Inject tool-call refusals, slow responses and missing data. This is the variation that separates a demonstration from a production component, and it is the cheapest to set up since it requires no new tasks, only an interceptor.
What the map allows that the score forbids
The value of this shift is decisional before it is scientific. A score licenses two verdicts, deploy or abandon. A map gives you a third, by far the most common in practice: deploy inside a perimeter whose edges you know.
Platforms have started tooling this approach. Google Cloud made agent and model evaluations generally available in its enterprise agent platform at the end of July 2026, with more than twenty pre-built metrics covering quality, safety, grounding, tool use and trajectory. The notable point is not the number of metrics but the declared abandonment of the single judge: adaptive rubrics tailor the judging criteria to each case rather than applying one brittle judging prompt across inputs that do not deserve the same questions. It is the same intuition as dense grading, transposed into a product.
That convergence should be read for what it is: a vendor selling an agent platform has an interest in evaluation becoming a product, and offering automatic judges does not settle the question of who evaluates the judges. But the underlying movement is consistent with independent research, and it points the same way as the 9 July article on the agent delegation grid: what is actionable for a decision is not the average performance level, it is where the frontier sits.
The pattern recurring among teams that got past the pilot stage is exactly this. They have stopped asking whether their agent is good, a question nobody can answer, and started asking precisely where it stops being good, information they convert into routing rules, iteration caps and human handover points.
What to put in motion this week
Take your current evaluation set and first check whether it has saturated. If all your candidates score closely and high, your test no longer measures anything, and replacing it is more urgent than comparing models.
Add partial reward. Break at least one representative task into separately graded subtasks, to distinguish complete failure from failure at the last step. Those two results lead to different decisions and your current scoring probably conflates them.
Write three versions of the same request, from most specified to most ambiguous, and measure the gap. If performance collapses between version one and version three, your problem is not the model, it is the interface between the business and the agent.
Wire in an interceptor that randomly rejects ten percent of tool calls and rerun your evaluation. The result will tell you whether you measured an agent or a set of laboratory conditions.
Finally, document the resulting frontier on one page, with the threshold beyond which you stop delegating on each axis. That document, not the score, is what should travel with the agent into production.
Conclusion
Agent evaluation is going through the same passage as availability measurement in distributed systems twenty years ago, when a global percentage stopped describing anything useful and was replaced by measures per service, per region and per percentile. The single score survives because it compares easily and fits on a slide, not because it informs. What a technical leader needs to know was never their agent's score, it is the exact place where it stops holding, and that place is only found by looking for it.
Sources: As of July 2026
- [Primary] Long-Horizon-Terminal-Bench: Testing the Limits of Agents on Long-Horizon Terminal Tasks with Dense Reward-Based Grading — Zongxia Li et al. (arXiv:2607.08964) — 9 July 2026, revised 13 July 2026 — https://arxiv.org/abs/2607.08964
- [Primary] Running the Gauntlet: Re-evaluating the Capabilities of Agents Beyond Familiar Environments — arXiv:2606.14397 — June 2026 — https://arxiv.org/abs/2606.14397
- [Primary] Evaluate agent performance — Google Cloud — July 2026 — https://cloud.google.com/blog/products/data-analytics/evaluate-agent-performance
- [Primary] Agent and Model Evaluations in Gemini Enterprise Agent Platform are now GA — Google Developers Blog — 31 July 2026 — https://developers.googleblog.com/agent-and-model-evaluations-in-gemini-enterprise-agent-platform-are-now-ga/
- [Secondary] A methodical approach to agent evaluation — Google Cloud — 2026 — https://cloud.google.com/blog/topics/developers-practitioners/a-methodical-approach-to-agent-evaluation
- [Secondary] AI Agent Evaluation Stack in 2026: Beyond Saturated SWE-bench Scores — Zylos Research — 25 March 2026 — https://zylos.ai/research/2026-03-25-ai-agent-evaluation-stack-2026-beyond-swe-bench/
Comments ()